


Education and the New Inequality Divides
https://doi.org/10.71609/iheid-8k03-nt37Education has long been seen to be a critical route to reducing economic, environmental or social inequalities. The education Sustainable Development Goal 4 (SDG 4) is one of six SDGs that explicitly manifest the international and national commitment to leave no one behind. To date we have seen important increases in access to education, but mainly for the least marginalised; the easiest to reach. Rather than driving social mobility and cohesion, fault lines of inequalities are deepening in education systems that fail to reach the marginalised communities they should serve.Rather than driving social mobility and cohesion, fault lines of inequalities are deepening in education systems that fail to reach the marginalised communities Existing gaps in global and local funding and data regimes fuel the perpetuation of quantitative and qualitative exclusions of learners from education and, as a consequence, from wider social and economic opportunities.
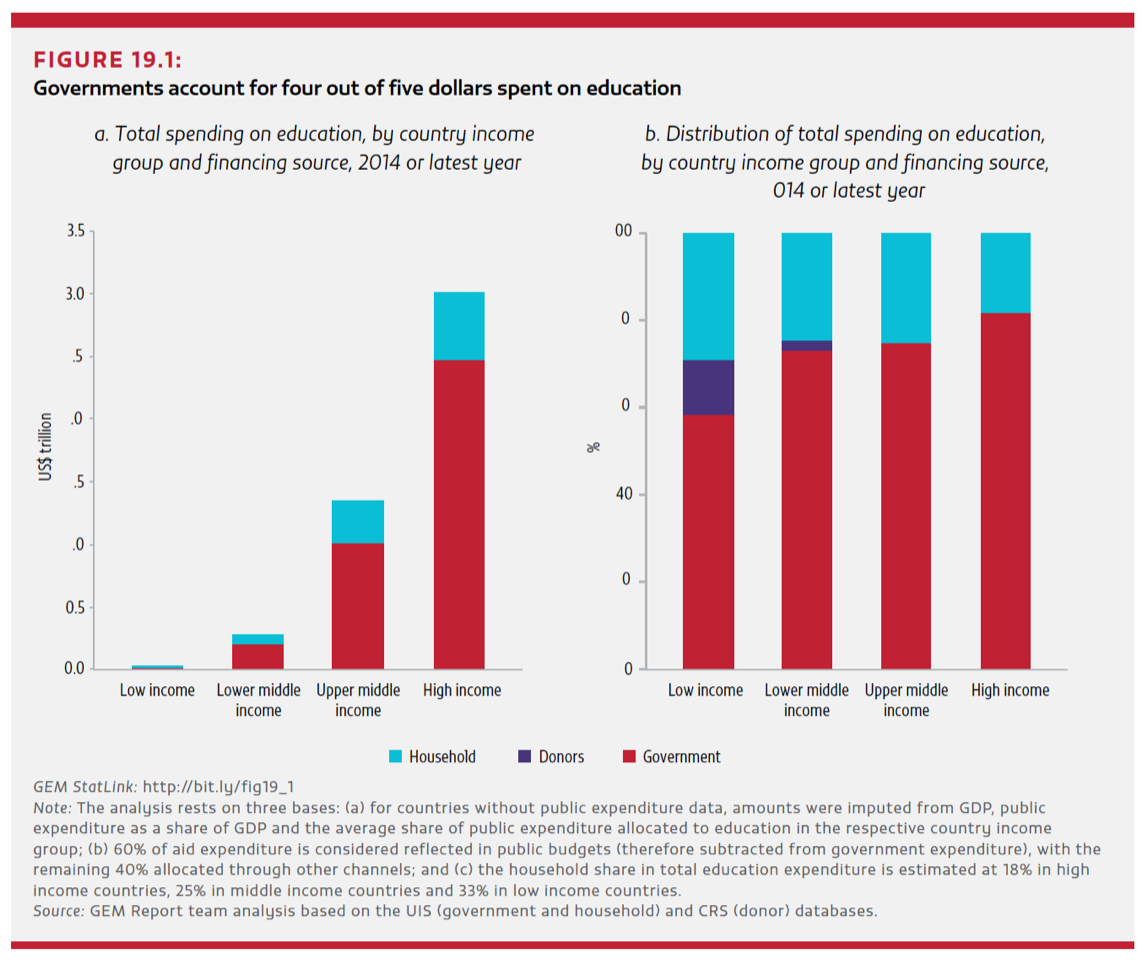
Funding for education globally is inadequate even for children and youth that are routinely included, and much more so for addressing the needs of those that are excluded outside and inside schools. The SDGs set two public education expenditure benchmarks for education: spend at least 4% of GDP or at least 15% of total public expenditure. However, one-third of countries failed to meet either of these benchmarks and many countries consistently miss both.[1] In a context of domestic underfunding and falling donor attention to education,[2] the potential benefits of private sector approaches in education are widely promoted. Purported benefits include providing much needed additional financing and making existing funding go further in efficiency savings.

However, there is also an important systemic risk inherent to favouring private sector approaches, particularly in terms of equity. Private financing (whether from foundations, for-profit businesses, or impact investments) tends to target learners that are easier to reach. As learners that are more difficult to reach are, by definition, more expensive to reach, prioritising cost-efficiency in private sector approaches might have the unintended consequence of further excluding already marginalised learners. There are also implications for public education systems: since the government must spend more to reach the remaining – less accessible – marginalised learners, public costs per pupil become higher than private ones. In these cases, costs per pupil that are lower for private providers and higher for public ones are no more than an artefact of government efforts to reach learners that have been left behind. As a consequence, government schools may be evaluated as less efficient and cost-efficient in comparison to private schools, due to this confounding and hidden variable.
Current data regimes in education (as in so many other sectors) are fuelling sub-optimal responses in the fight against social inequalities. Today, data and indicators are one of the most effective devices framing the global development discourse. Nevertheless, current data regimes in education (as in so many other sectors) are fuelling sub-optimal responses in the fight against social inequalities. In education, as with other fields of social sciences concerned with inequalities, data collection practices and processes reinforce fault lines of inequality, whether in terms of disability, gender, indigeneity, migratory status, race, sexual orientation, socio-economic status or the intersections between them.
Limits in global data regimes preclude the ways in which inequalities may be addressed by the global development community. Excluded populations need to be visible and audible, while not leaving them open to stigmatisation, surveillance and reprisal. NORRAG’s Missing Data Summit in 2022 (the mid-point between the adoption of the SDGs and the deadline for meeting them) will address the challenges of missing data for SDG 4, and in particular Target 4.5 on equity in education. The commitment to “leave no one behind” cannot be achieved while those who remain underserved are also underrepresented in the data.
Limited funding goes hand in hand with limited data. Where there is no funding to collect certain data, they will not be collected; where there are no data to show a need, funding will not follow. In practice, this means that the most marginalised are usually the most invisible and consequently the least addressed. Those who live in fragile contexts or emergency situations are even more poorly served by existing data collection regimes. Those for whom data should be collected as a priority thus become doubly excluded: first from data collection and then from humanitarian or development interventions.
The quality of inclusiveness in education also deserves further attention, particularly the gaps between de jure and de facto inclusion. Learners from marginalised groups may be formally included in school, training or college and yet remain effectively excluded due to the practices they find there. Decolonial and intersectional perspectives provide a vocabulary with which to examine the quality of inclusion. First, a decolonial standpoint raises questions about the unequal terms on which inclusion may be undertaken in education establishments, and the lack of local contextualisation of curricula, teaching practices and “global” public goods that have been developed in the North. Secondly, intersectionality highlights the effects on the individual of the complex interactions between several aspects of marginalisation and inequality.
In practice, this would mean: changing curricula to include historically excluded stories, such as the richness of non-Western civilisations and cultures; changing traditional “chalk-and-talk” ways of teaching rather than punishing the children who do not learn through them; bringing students’ cultures, languages, genders, sexualities and perspectives into the classroom with respect; questioning what we leave out of students’ education by ignoring other ways of knowing such as indigenous knowledge systems. In the absence of these actions, pupils may be formally included in educational and social systems that actually exclude their complex needs, contributions and contexts, rather than building on their existing capabilities to enrich learning for all.The ongoing COVID-19 pandemic has increased understanding of the negative impacts of even short-term exclusion from education
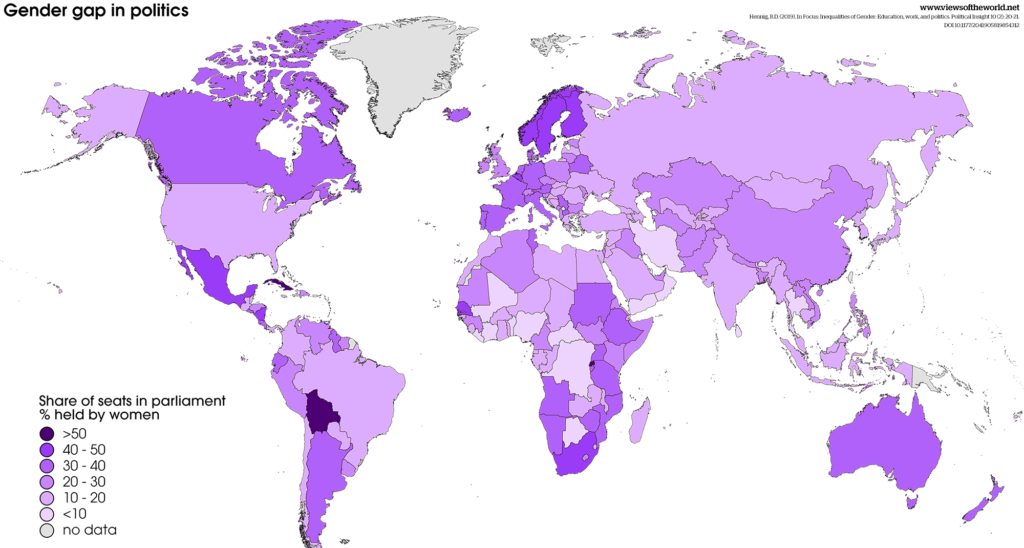
The ongoing COVID-19 pandemic has increased understanding of the negative impacts of even short-term exclusion from education on pupils’ and students’ learning, as well as on their and their parents’ and teachers’ physical and mental health, jobs and job prospects, as it deepens social and economic inequalities. These impacts cut more deeply for marginalised groups. Funding and data regimes that target equity and inclusiveness are critical for achieving SDG4 in education, and allowing education to contribute to the broader SDG agenda to leave no one behind (SDG10), particularly women and girls (SDG5).
[1] UNESCO, Global Education Monitoring Report 2020: Inclusion and Education: All Means All (Paris: UNESCO, 2020), 321.
[2] UNESCO, Global Education Monitoring Report 2020, 330.
Electronic reference
Terway, Arushi, Moira V. Faul, and Patrick Montjouridès. “Education and the New Inequality Divides.” Global Challenges, no. 9, March 2021. URL: https://globalchallenges.ch/issue/9/education-and-the-new-inequality-divides. DOI: https://doi.org/10.71609/iheid-8k03-nt37.Five Maps on Inequality
© Global Challenges: The Graduate Institute Dossiers
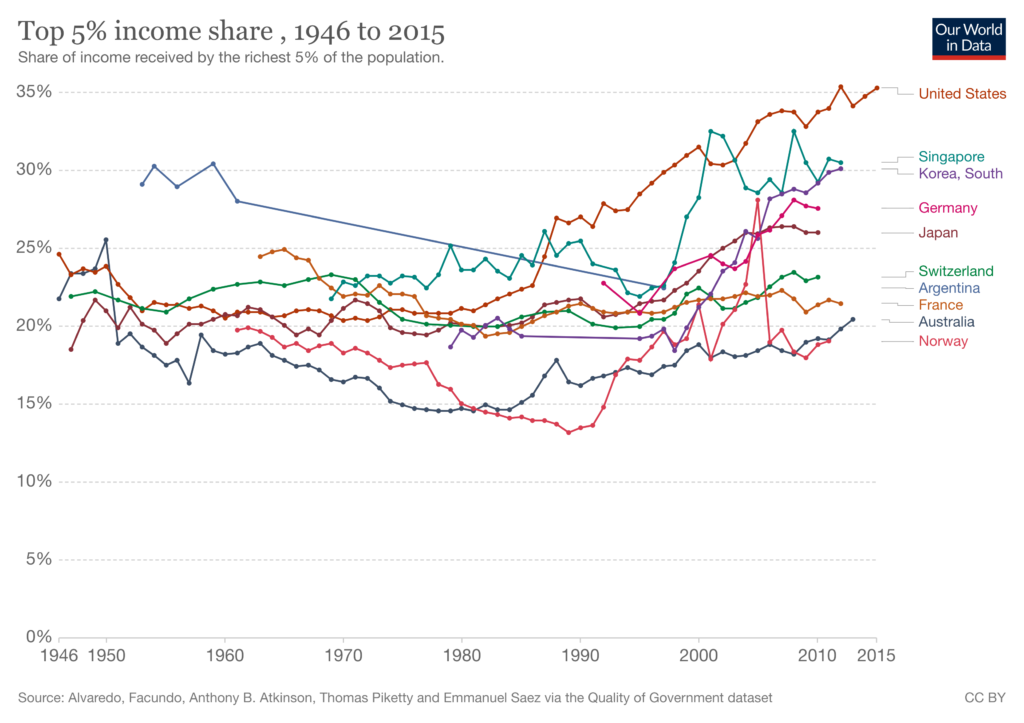
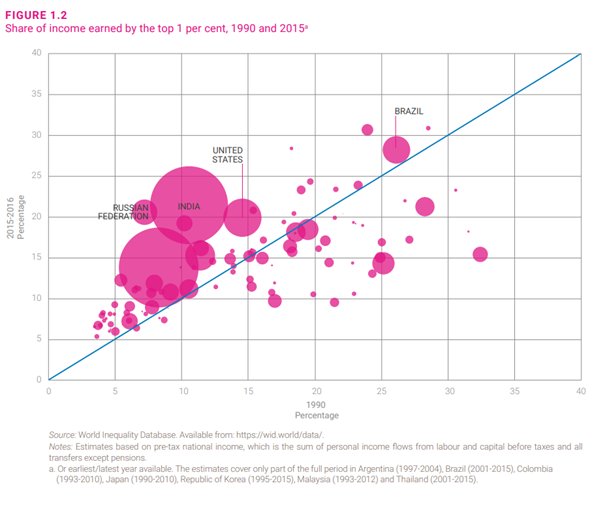
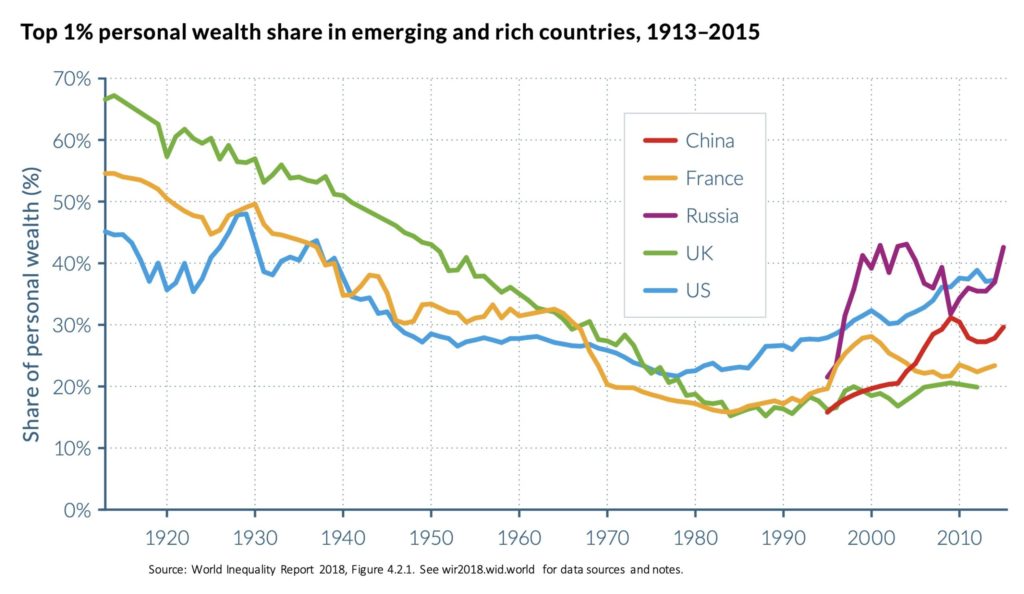
Five Graphs on Inequality
PODCAST: Inégalités, anthropologie et développement – Gilbert Rist
Graduate Institute, Geneva.
PODCAST: Inequalities and Humans Rights – Irene Khan
Graduate Institute, Geneva
RESEARCH DOCUMENTARY: Inequality and Conflict – Beyond Us and Them
Realised and financed by the the FNS, and strongly supported by the Gender Centre (Graduate Institute, Geneva), this research documentary film is the result of a participatory filmmaking process and presents three projects conducted in Guatemala, Nigeria, Sri Lanka and Indonesia within the Social Conflicts module of the Swiss Programme for Research on Global Issues for Development (r4d programme). It features the research context and findings of the Gender Centre’s project “The Gender Dimensions of Social Conflicts, Armed Violence and Peacebuilding”.
TV NEWS: Hustlers vs Dynasties: Experts Warn Kenyans against the Narrative
The Youtube NTV Kenya channel
Thomas Piketty and the Inequality Economists
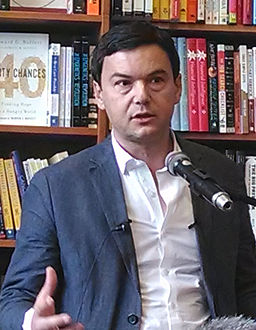 Thomas Piketty at the reading for Capital in the Twenty-First Century on 18 April 2014 at the Harvard Book Store in Cambridge, Massachusetts.
Over the last decade, a vivid scholarly debate over the issue of inequality and its drivers has taken place among economists and attracted a lot of public attention. It includes, most prominently, Thomas Piketty and other French economists such François Bourguignon, Thomas Philippon, Emmanuel Saez and Gabriel Zucman but also Anglo-Saxon scholars such as Anthony Atkinson, Joseph Stieglitz and Branko Milanovic. Piketty landed an Amazon’s best-seller with his book Capital in the Twenty-First Century (2014), in which he argues that welfare states and social policies are the exception in history while the general tendency under capitalist conditions is for inequality to rise as the returns to capital are greater than the general rate of economic growth. Piketty therefore opposed previous theories, such as Simon Kuznets’ U-shape model assuming that under capitalism inequality first rises to subsequently decline with the apparition of redistributive mechanisms and policies. From Piketty’s perspective, the “egalitarian” decades from the 1930s to the 1970s, while constituting an exception, also prove that economic inequality is not predetermined but may be acted upon through political and social measures. Others such as Branko Milanovic have argued for more cyclical approaches to inequality, suggesting that it is sporadically checked by wars, plagues and demographic disruptions that are exogenous to the market.
Further readings:
- Robert H. Wade, “The Piketty Phenomenon and the Future of Inequality”, real-world economics review, no. 69 (7 Oct. 2014): 2–17.
- Mike Savage, “An Interview with Thomas Piketty, Paris 8th July 2015”, Working Paper no. 1, International Inequalities Institute, LSE, September 2015.
Measuring Inequality
Inequality measurement can take many forms. Depending on what kind of inequality is being measured (economic, health, education, etc.), different types of indicators will be used (revenue, wealth, average years of schooling, life expectancy…). Measuring inequality further depends on the units of measurements (individuals, households, tax-paying units, etc.) and the types of entities/groups that are being compared. Measuring inequality across country or regions thus differs from measuring inequality within a given society (e.g., between specific segments of a given population) or between citizens globally.
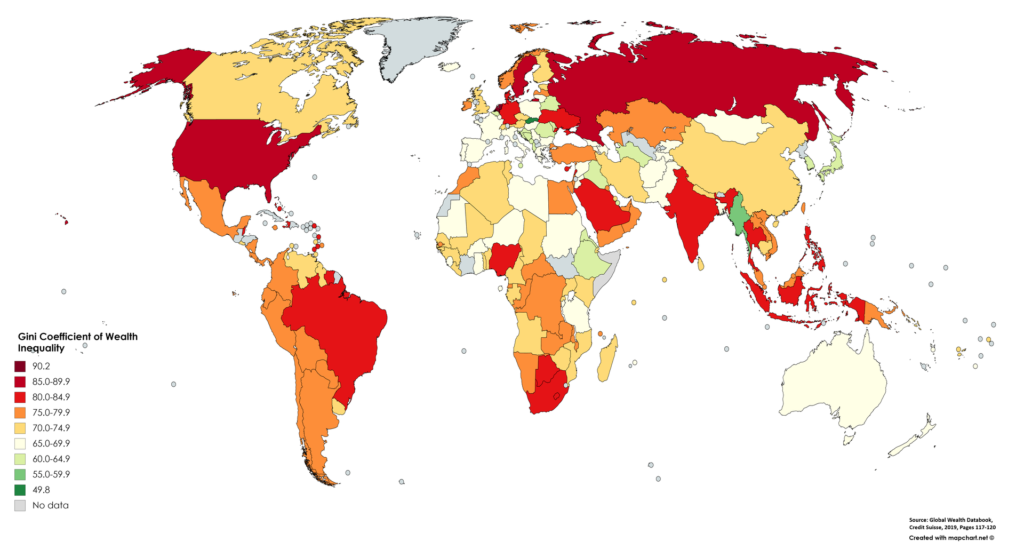
Gini Index
The most common index to measure economic inequalities in terms of revenue or wealth is the Gini coefficient. It measures the extent to which the distribution of income across a society deviates from a perfectly equal distribution. It is based on the Lorenz curve, which represents the cumulative proportion of the population on the horizontal axis and the cumulative proportion of income on the vertical axis. If one person earned all income (maximum inequality) the Gini coefficient would be equal to 1. If income was shared equally between all, the Gini coefficient would equal 0.
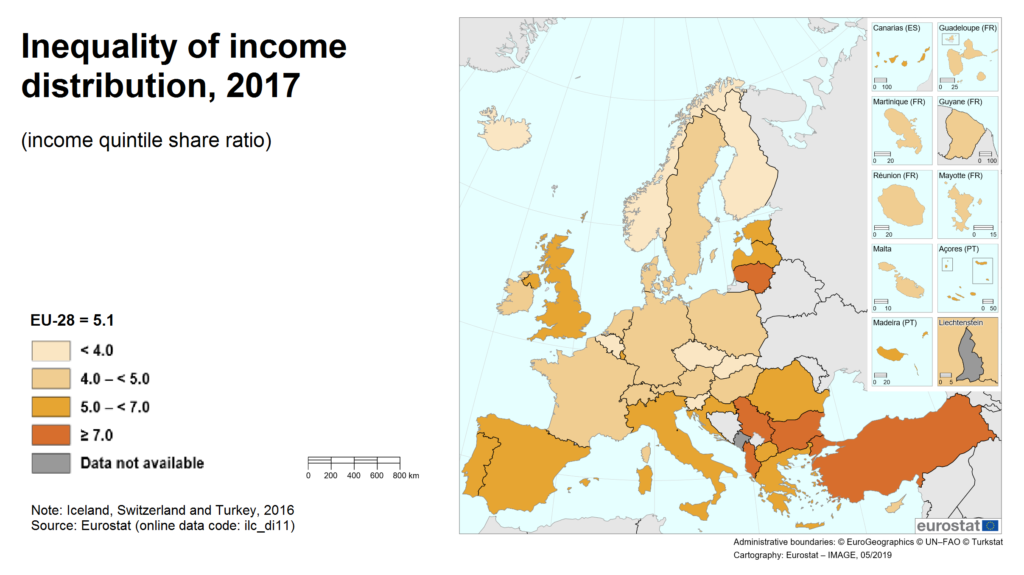
Palma Index (or Ratio Measures)
Ratio measures compare how much revenue or wealth is held by a specific segment of the population as compared to another. They allow to adjust for the Gini index’s oversensitivity to changes in the middle of the distribution. The Palma ratio, for instance, measures the share of national income of the top 10% compared to that hold by the lower 40%. In more equal societies this ratio will be 1 or below but in very unequal societies it might go up to 7.
Theil Index
Theil indexes, finally, measure inequality in terms of how wealth or revenue is spread among different regions (e.g. urban and rural).
For further reading:
- UNDESA, Inequality Measurement, Development Issues no 2, 21 October 2015
- GSDRC, “Measuring Inequality”
Debate on Inequality and the Social Contract

Liberty and equality entertain an uneasy and fraught relationship. How to reconcile the two has been one of political theory’s central quandaries. Proponents of radical approaches to political equality such as Rousseau have argued that equality may only come at the prize of providing a narrow – or positive – definition of freedom. An approach that has also been applied by the French revolutionaries who, most notably during the Reign of Terror (1793–1794), applied a strict definition of what it meant to be free under republican conditions. Liberal proponents, on the other hand, have preferred a negative approach to freedom – privileging being free over being equal – by confining equality to law and reserving freedom to the private realm of individual expression. The radical impetus of equating being free to being equal may thus be opposed to the liberal impetus of equating being free to being different.
Political philosophers have further debated on whether inequality stems from history – or, as Rousseau suggests in his Second Discourse, from civilisation – and thus depends on human intervention or whether it is an inalterable anthropological constant. Liberals have argued the former, insisting that while inequality remains the norm in nature, it is mankind’s role to tame it through policies and laws (e.g., social contracts). Sociologists such as Gaetano Mosca and Robert Michels have come to the more sobering conclusion that elites are a quasi-permanent fixture of human societies and that, eventually, a minority of actors would come to dominate all political systems, even democracies. John Rawls, finally, proposed an elaborate theory of social justice arguing that the social contract needs to guarantee at once fundamental rights to individuals, equality in terms of opportunities, and that economic inequality is justified only to the extent that it serves to improve the lives of the worst off through redistributive mechanisms.
For further reading:
Jeff Manza, “Political Inequality”, in Emerging Trends in the Social and Behavioral Sciences, ed. Robert Scott and Stephen Kosslyn (John Wiley & Sons, Inc., 2015): 1–17.