The Moving Fault Lines of Inequality | Figure for the Issue
The Moving Fault Lines of Inequality
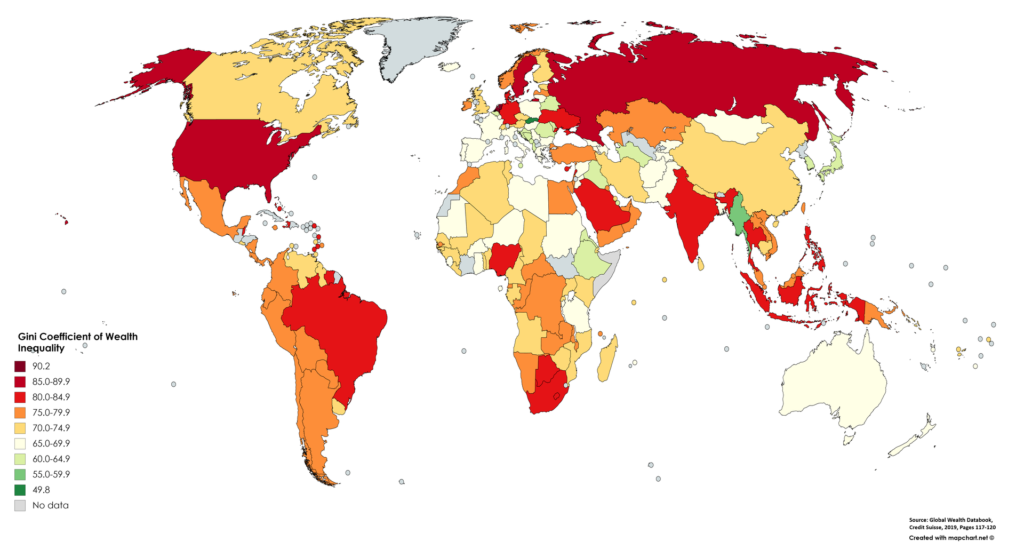
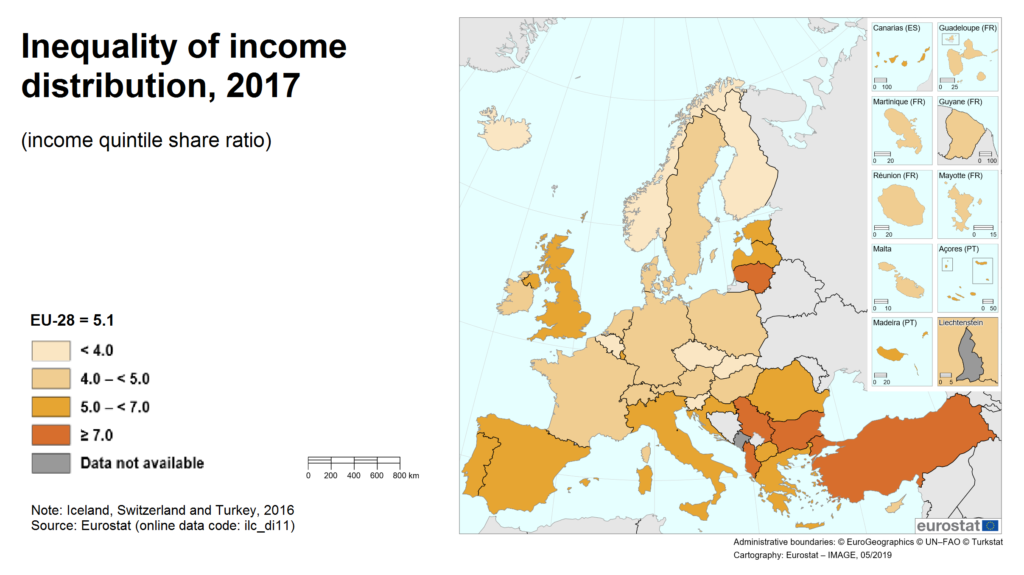
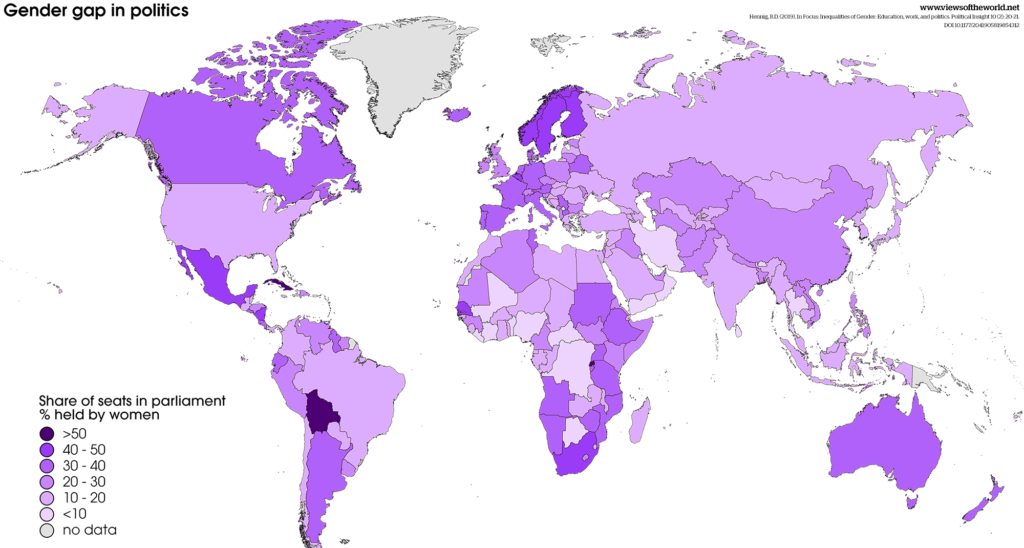
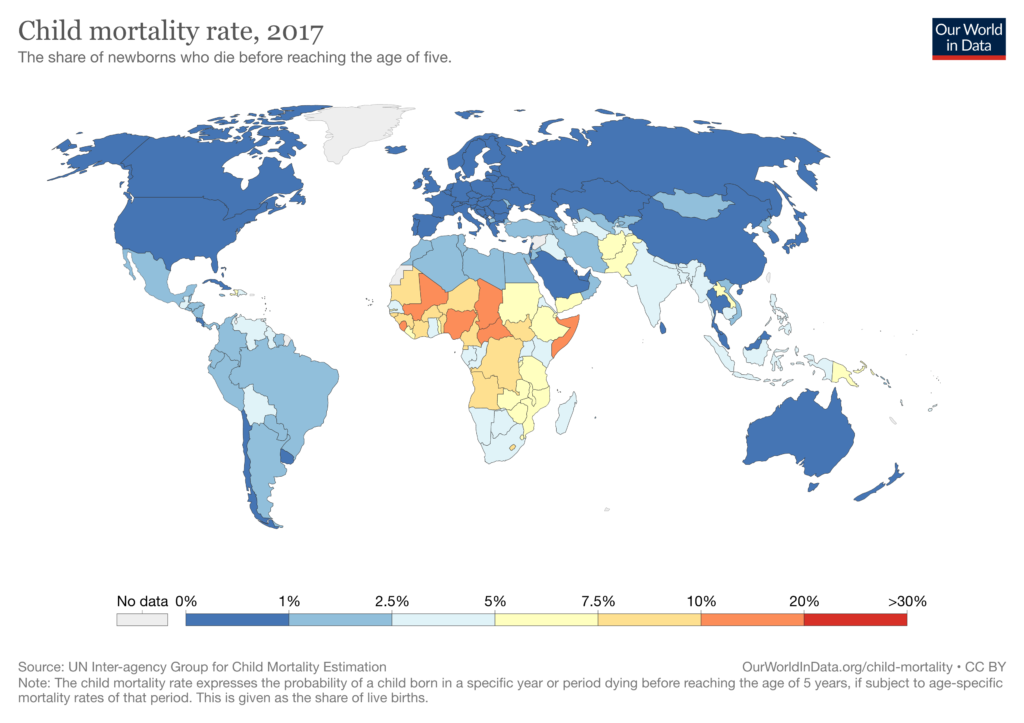
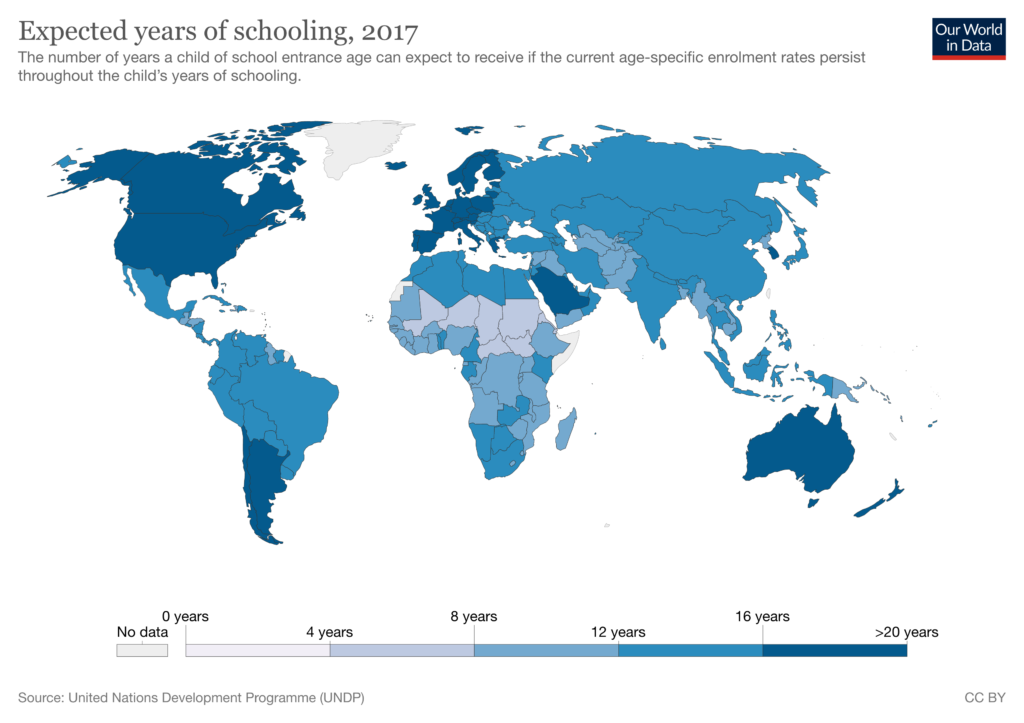
Five Maps on Inequality
© Global Challenges: The Graduate Institute Dossiers
© Chappatte, The Boston Globe www.chappatte.com
© Global Challenges: The Graduate Institute Dossiers
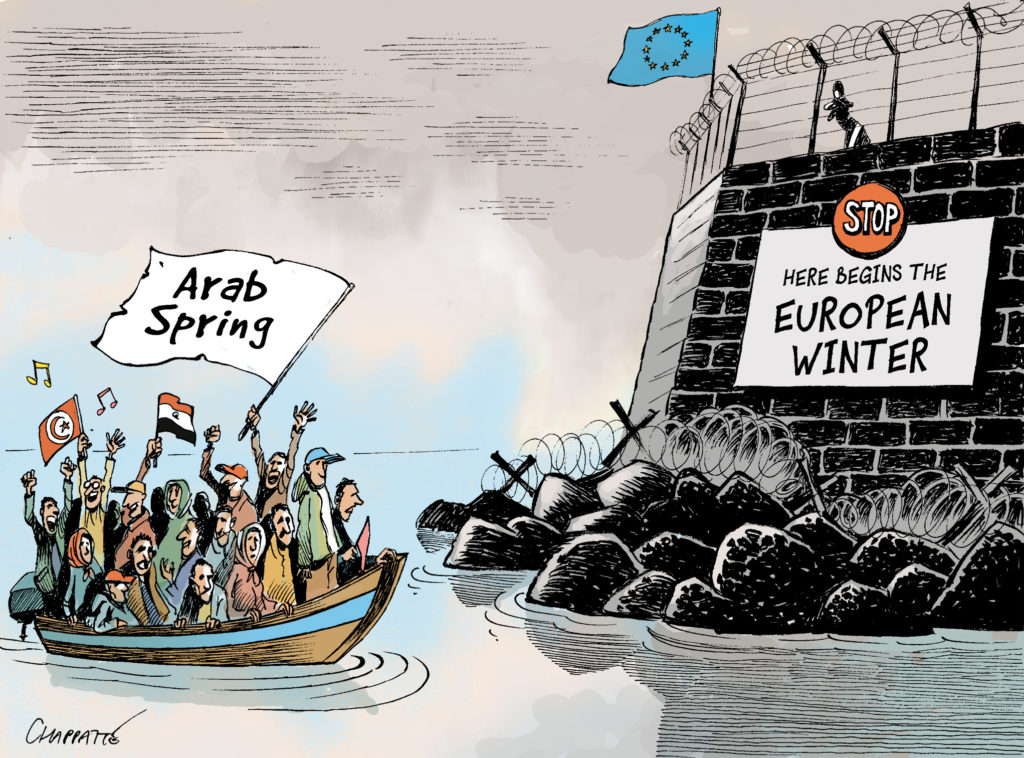
We currently face a baffling paradox. While since the fall of the Berlin Wall in 1989 a seemingly inexorable process of globalisation has been foreshadowing a peaceful and frontierless world, the number of walls across the world has been rising at a steady pace. Liberal and open societies buttressed by trade, international law and technological progress were supposed to implacably contribute to the erosion of frontiers and walls between nations. However, in a context of surging populist discourses, securitarian anxieties and identitarian politics as well as concomitant flows of migration alimented by climate change, conflict and poverty, nations have recently started to barricade themselves behind new walls.
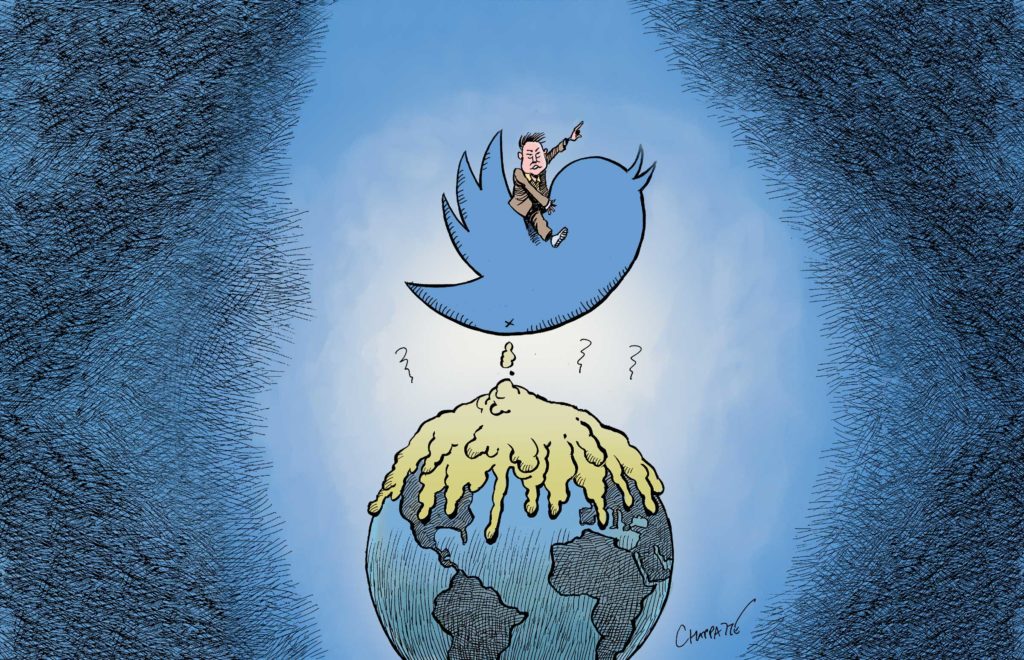
The present issue seeks to better apprehend the nature of this new era of digital disinformation and how it differs from prior eras marked by the dissemination of more traditional propaganda (notably the Cold War) or by the spread of American (or liberal) soft power through mass media and consumption. In so doing the issue seeks to address a series of questions such as: has traditional propaganda consisting in over-selling a model or ideology by means of manipulation and mass media been replaced by the generalisation of disinformation in the post-truth era characterized by systematic epistemic deconstruction and the outright discreditation of any truth claims? What is the role of states (as opposed to other actors) in this process and what tools and operational mechanisms are they mobilizing to pursue their global (dis-)information campaigns? What is the impact of the generalisation of alternative facts and disinformation campaigns on the international order? Who is to win and lose from it? What can be done, notably at the international level and the UN, to counter the noxious effects of global disinformation campaigns and to recreate trust in the global information order?
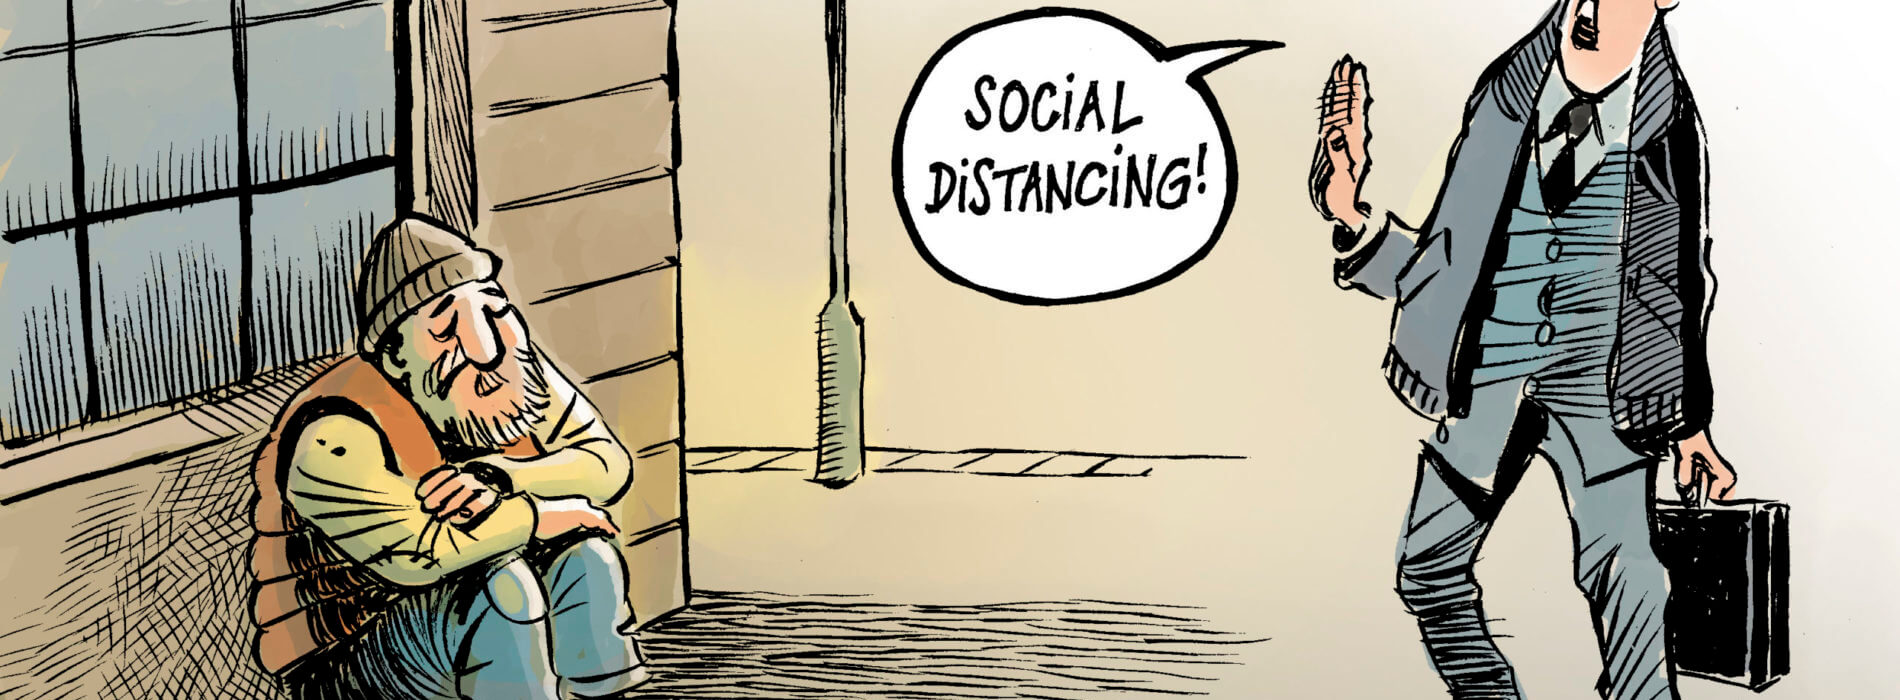
After the outbreak of COVID-19 – a virus constituting a genuinely worldwide risk – fear internationalised in just a few weeks. As the COVID crisis has profoundly shaken societies on a global scale it has contributed to a reconfiguration – perhaps a multiplication – of risks and their perceptions. While foremost constituting a biological hazard, the pandemic has large repercussions on other types of risks, ranging from long-term economic and digital disruption to psychological distress and political confrontation. The nature and frontiers of risks are thus moving as the multilateral system, the most adequate framework to deal with global risks, is ailing and current risk mitigation strategies are increasingly put to question. The six articles of the present Dossier explore these changing hierarchies of risk and the underpinning structural issues that endanger our existence.